Our Product
An accurate dot tracking software and force detection set-up is proposed to measure vessel displacements and forces during TAVR procedure simulations using a catheter and an anatomical model of the femoral artery.
Testing Apparatus Design
Our solution is to conduct tests on an anatomic model which represents the transfemoral artery region. We will record the force and displacement values of the simulated TAVR procedure as the sheath and guidewire are inserted into the model. There are three components to the testing apparatus design: (1) the anatomic model, (2) force detection device, and (3) software.

Anatomic Model
The anatomic model provided by Edwards Lifesciences represents the transfemoral artery region. Selected materials for the model include silicone for the skin, polyurethane for the vessels, and a 3D printed composite block for the femoral bone and its surrounding muscle. Pink and green sticker dots were placed on the model to mark the top and side view of the vessel, respectively. During testing, the anatomic model was wetted using a water-filled syringe to ensure proper lubrication during the simulated TAVR procedure.

Recording Setup
The recording setup will be inside a light box with the anatomic model placed in a water bath. Two cameras with polarizing lenses will be positioned so they capture the model from the top and side view. Before recording, the experimentor must wear gloves and insert the introducer sheath containing the guidewire at least one inch from the vessel entrance. Footage of the catheter advancement through the tortuous vessels is then taken until the tip of the introducer sheath and guidewire exits the vessel.
Simulated TAVR Insertion Video
Software
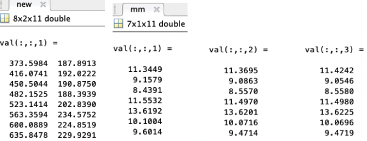
Our current prototype code utilizes MATLAB to accurately detect the dots on our anatomic model using color thresholding. By detecting the colored dots, we are able to obtain preliminary results and data to calculate deformation such as centroid location, ellipse area, relative coordinates, and distances between the centroids.
Color Thresholding

Our solution for dot tracking utilizes colored dot sticker tracking using color thresholding. The code effortlessly isolates user-specified colors within the frames of a video, or even singular images, and cleanly filters out all other background interference. On controlled trials, results indicated a 100% dot detection success rate.
Data: Centroids and Distances

The first portion of data we obtain from our code are the centroid locations of the dots, which are essential because they represent a fixed position on the model. Our solution can quickly measure and record these locations and their changes, which correlate to the model’s deformation. The second portion of obtained data are the distances between all the dots’ centroids per frame. Currently, these distances can be used to roughly represent the stretching and deformation of the simulated anatomical model. Our code can provide tangible data in that we can correlate pixel distance to real life distance (in millimeters).
Future Developments
To improve our testing apparatus, we plan on integrating the dot detection code with a force detection readings from a donut load cell. This would allow for better analysis of vessel deformation as the delivery system travels through the femoral artery. In addition, we plan on creating an index or scale for our distance data that will define the extent of deformation by percent difference in dot position (comparing beginning of experiment at the anatomical model's resting state to end of the experiment with full sheath insertion).
